Pan-African Journal of Health and Psychological Sciences
Assessing Gaps in Adolescent Mental Health Care in Rural Ghana
Article Information
Abstract
Keywords
Full Article
1. Introduction
Roughly half of all mental health conditions emerge before age 14, yet most go undiagnosed and untreated (World Health Organization, 2025). This treatment gap is most severe in sub-Saharan Africa, where adolescents make up a disproportionate share of the population but mental health systems remain critically understaffed.
Ghana’s Mental Health Act 846 (2012) has not translated into consistent service delivery, and rural districts in particular lack trained personnel, community-based resources, and freedom from stigma (Graves et al., 2024). A national policy review found that fewer than one in five components of Ghana’s own Adolescent Health Service Policy and Strategy (2016–2020) had been fully implemented, with mental health services consistently the weakest-resourced element of the strategy (Agblevor et al., 2023). Schools, which nearly all adolescents pass through regardless of household income, remain the most consistent institutional touchpoint available for early identification and support.
In the Bono Region, including Jaman North District, more than 10,000 students are enrolled in senior high schools, yet the education sector conducts no formalised mental health screening and provides no standard counselling infrastructure. Because adolescent mental health literacy and help-seeking behaviour are shaped substantially by school and peer environments, understanding depressive symptom burden at this level is a prerequisite for designing interventions that Jaman North’s schools could realistically deliver.
Epidemiological data on adolescent mental health in rural Ghana are sparse. National surveys skew toward urban populations, and the sub-regional data that do exist rarely disaggregate to the district level or use screening tools validated for Ghanaian adolescents specifically. This absence of local evidence makes it difficult to justify or design district-level resource allocation.
Beyond the absence of prevalence data, several less-measurable factors compound the treatment gap. Mental health literacy is low across low- and middle-income countries generally: many people cannot name common disorders or identify what treatment involves (Renwick et al., 2022). Layered on top of this are structural barriers such as distance and cost, and social barriers such as stigma and lack of family support (Baloji et al., 2025). None of these factors personal, social, or structural has been quantified for SHS students in rural Ghana, which limits the ability to design interventions that target the barriers that actually apply here rather than those documented elsewhere.
1.3 Research Aim and Objectives
This study quantifies adolescent mental health care gaps among SHS students in Jaman North District through three research questions:
RQ1: What is the prevalence and severity of depressive symptoms among SHS students in Jaman North District, and how do these outcomes vary by socio-demographic characteristics?
RQ2: What is the level of mental health literacy among students, and how is accurate knowledge associated with willingness to seek help or prior help-seeking behaviour?
RQ3: What individual, social, and systemic barriers most significantly predict non-utilisation of mental health services among students, and to what extent are school-based interventions perceived as accessible and acceptable?
This is, to our knowledge, the first study to combine PHQ-9 screening, mental health literacy assessment, barrier identification, and evaluation of school-based intervention acceptability in a single SHS sample in rural Ghana. It provides district-level evidence that Jaman North’s schools and health directorate can act on directly, and a template that other rural districts facing similar resource constraints could adapt.
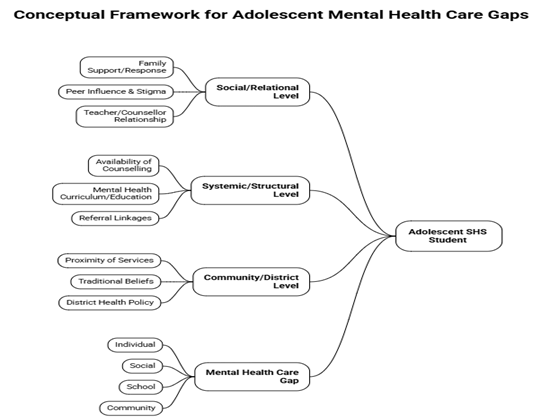
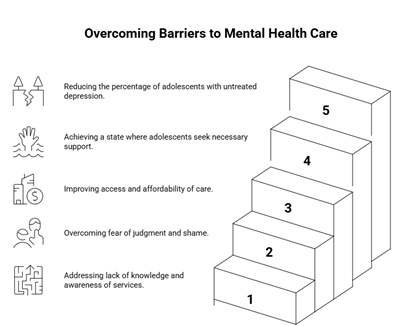
This study organises its measures and analysis around a three-level barrier framework adapted from Le et al. (2022) and Metzger et al. (2023): individual factors (symptom burden, mental health literacy, personal beliefs about what “mental health” means), social factors (stigma, peer judgment, anticipated family response), and systemic factors (service availability, awareness of where to go, referral pathways between schools and district health services). RQ1 maps primarily onto the individual level, RQ2 spans individual and social levels (literacy shaping, and being shaped by social attitudes), and RQ3 spans social and systemic levels (help-seeking barriers and the acceptability of school-based intervention). Figure 2 (Section 5.3) presents this same framework as a stepwise model once the results are available to populate it; it is introduced here so the Results and Discussion sections can be read against a single consistent structure rather than as three loosely connected sub-studies.
2.1 Adolescent Mental Health Epidemiology in Sub-Saharan Africa
Adolescent mental health burden in sub-Saharan Africa has risen alongside urbanisation, poverty, conflict, and the lingering effects of the COVID-19 pandemic. A global analysis found that 25.2% of children and adolescents showed clinical depression symptoms during the pandemic period roughly double pre-pandemic estimates, and higher among girls and older adolescents (Kim et al., 2024). African data point in the same direction: Nakie et al. (2022) found 41.4% of Ethiopian high school students showed depressive symptoms using DASS-21, and Karki et al. (2022) found 56.5% of Nepalese students showed symptoms of depression, anxiety, or stress.
Comparisons across these studies are complicated by inconsistent methodology screening instrument, cut-off, and sampling frame all differ and West African data remain particularly thin. Fernandes et al. (2023) estimated depression at 27% among high school and university students worldwide, a figure closer to what this study finds, though the samples are not directly comparable.
2.2 Mental Health Literacy and Help-Seeking Behaviour Among Ghanaian Youth
Mental health literacy (MHL) the ability to recognise disorders, know what services and self-help options exist, and hold attitudes conducive to seeking care is consistently associated with earlier and more frequent help-seeking (ABESINGHE et al., 2023). Where MHL is low, people who do eventually seek care tend to delay doing so (Zhao, Li and Zhao, 2023).
In Ghanaian and other African settings, adolescents frequently equate mental illness with “madness” requiring psychiatric intervention, a framing that discourages early or informal disclosure of milder symptoms (Baklola et al., 2024, in a Saudi sample, found the reverse pattern higher MHL predicting more help-seeking suggesting the relationship, while consistent in direction, is not universal in strength). Addy et al. (2021), studying 405 adolescents across four Ghanaian SHS, found that the school guidance and counselling unit was the primary support system in name but was widely distrusted by students over confidentiality, and was frequently staffed by teachers without counselling qualifications a structural weakness that plausibly compounds the literacy gap documented in the present study.
Qualitative work elsewhere reinforces this picture: Goodfellow et al. (2022) found Scottish adolescents needed literacy about treatment effectiveness, not just disorder recognition, to act on help-seeking intentions; Williams et al. (2025) describe informal help-seeking through social networks and religious institutions as the dominant pathway in rural African settings; and Bu et al. (2024) modelled MHL’s effect on help-seeking as running through reduced stigma and increased perceived social support, rather than acting directly.
2.3 Structural and Systemic Barriers to Mental Health Care Access in Rural Settings
Barriers to mental health service use are usually described across three levels individual, social, and systemic (Le et al., 2022). In LMIC rural settings specifically, these compound: workforce shortages and weak referral systems sit alongside genuine geographic and financial barriers (Chikumbu et al., 2022). South African and Egyptian university samples show comparable patterns, with practical access barriers and a preference for self-reliance both reducing formal help-seeking (Allie, Bantjes and Andriessen, 2024; Razek and Nasser, 2025).
Stigma remains the most commonly cited first-order barrier across sub-Saharan Africa (Poku, 2021). In Ghana specifically, traditional attribution of psychological distress to spiritual causes reduces perceived legitimacy of biomedical and psychosocial treatment (Metzger et al., 2023). At a policy level, Agblevor et al. (2023) trace part of this gap to implementation failure rather than absence of policy: Ghana’s national adolescent health strategy nominally covers mental health, but stakeholders across national and district levels described mental health as the least-resourced and least-monitored component of adolescent health service delivery, with no routine data collection to track whether services reach students at all.
2.4 School-Based Mental Health Interventions in Low-Resource Contexts
Schools are a natural delivery point for adolescent mental health support because they reach students who might not otherwise access care. Ma, Anderson and Burn (2022), reviewing 21 RCTs, found school-based interventions produced moderate gains in literacy and stigma reduction but weaker evidence for actual help-seeking behaviour change. A larger meta-analysis of 29 RCTs found school-based programmes reduced depression and anxiety symptoms (effect size 0.24, p=0.002), with clinician-delivered and CBT-based models performing best (Zhang et al., 2025).
Implementation constraints are well documented: low-resource settings need better-trained counsellors, face high teacher-to-student ratios, contend with school-level stigma, and often lack any referral pathway to district health services (Nemiro et al., 2022). Lai et al. (2022) argue school-based services do more than provide access they create the relational security that makes disclosure possible in the first place. Peer-led models may suit resource-constrained settings particularly well: Ahorsu et al. (2021) found a peer-led intervention combining MHL promotion with coping-strategy workshops improved mental health awareness among Hong Kong university students, a model that could plausibly translate to Jaman North’s schools given their reliance on peer and teacher relationships documented in Section 2.2.
No prior study has measured depressive symptom prevalence, mental health literacy, service access barriers, and school-based intervention acceptability together, using standardised tools, among SHS students in rural Ghana. This study addresses that gap and produces an evidence base tailored to Jaman North’s district-level policy context specifically, rather than extrapolated from national or urban data.
3.1 Research Design and Study Setting
This study used a cross-sectional quantitative design, appropriate for establishing baseline prevalence and examining associations at a single point in time in a setting with limited prior research infrastructure.
Jaman North District, in Ghana’s Bono Region, is a predominantly agricultural district with limited health infrastructure and no dedicated adolescent mental health services. The district’s SHS institutions serve most secondary-school-aged residents, making school-based data collection the most complete and logistically feasible approach available, in the absence of a reliable community sampling frame.
3.2 Study Population, Sampling, and Data Collection Procedures
The target population comprised SHS students aged 15–19 years enrolled in Jaman North District schools. A total of 217 students were recruited through multistage cluster sampling: schools were selected at the first stage, classes were randomly selected within those schools at the second stage, and all eligible, consenting students within selected classes were included at the third stage.
Jaman North District has six senior high/technical schools, all broadly similar in student population and academic programmes offered. A multi-stage sampling design was used: in the first stage, three of the six schools were selected by simple random sampling (names written on paper, folded, and drawn from a container); in the second stage, classes were selected from each chosen school by simple random sampling; in the third stage, participants were drawn from each school’s attendance register by simple random sampling, with 75 students targeted per school. Across the three schools, 217 of 225 approached students consented and completed the questionnaire, a response rate of 96.4% (non-response rate 3.6%).
Sample size was calculated to estimate depression prevalence with adequate precision; the achieved sample of 217 supports the overall prevalence estimate but is likely underpowered for some subgroup comparisons, particularly given the small numbers of male participants (n=77) and day students (n=15) a constraint now stated explicitly in Section 5.5.
Students completed a structured, self-administered questionnaire in four parts: (1) socio-demographic characteristics; (2) PHQ-9 depression screening; (3) mental health knowledge and help-seeking; and (4) barriers and school-based intervention perceptions. Research assistants were trained to clarify item wording without prompting particular answers, while otherwise leaving students to complete the questionnaire independently.
No individual observation of responses occurred during data collection: research assistants were present only to distribute and collect questionnaires, clarify item wording on request, and maintain a quiet setting, and did not view or record any student’s individual answers.
3.3 Measurement Instruments and Variables
The PHQ-9 is a nine-item self-report tool assessing depressive symptom frequency over the preceding two weeks, scored 0–3 per item for a total range of 0–27. Standard cut-points were used: none/minimal (0–4), mild (5–9), moderate (10–14), moderately severe (15–19), and severe (20–27); probable depression was defined at a threshold of ≥10, consistent with adolescent studies elsewhere in sub-Saharan Africa. The PHQ-9 has demonstrated validity across African adolescent populations broadly, and a Ghana-specific validation study among senior high school students supports its use in this population: Anum, Adjorlolo and Kugbey (2019) found a stable one-factor structure, invariant across sex, with acceptable internal consistency and construct validity in a sample of 553 Ghanaian SHS students.
Mental health literacy was assessed through items covering: (a) recognition of the term “mental health,” (b) ability to define it, (c) source(s) of information, and (d) ability to identify common mental health conditions from a list. An overall knowledge classification (poor/fair/good) was derived by summing correct responses across these items and grouping students into tertiles; reliability statistics (Cronbach’s alpha) for the literacy and barrier item sets were not computed for this sample and are noted as an open item in Section 5.5.
Barrier assessment items drew on established help-seeking barrier frameworks, covering service awareness, prior help-seeking, specific barriers, perceived community support, and expected family response.
Descriptive statistics (frequencies, proportions, means, standard deviations) were generated for all variables, with 95% confidence intervals now reported for all key prevalence estimates (Section 4). Bivariate associations between socio-demographic factors and three outcomes PHQ-9 score, probable depression status, and help-seeking behaviour were tested using independent-samples t-tests and Pearson chi-square tests, at p<0.05 (two-tailed), using IBM SPSS Statistics v28.
An unadjusted binary logistic regression was subsequently run to identify predictors of non-help-seeking, and a chi-square test of association between mental health knowledge classification and help-seeking status was run to address RQ2; both are reported in Section 4.6 (Tables 8–9).
This study was conducted in accordance with the Declaration of Helsinki. Ethical approval (Ref: CHRPE/AP/238/25) was obtained from the Committee on Human Research, Publications, and Ethics of the Kwame Nkrumah University of Science and Technology, Kumasi, Ghana, valid 2 April 2025 to 1 April 2026, with additional permission from the Jaman North District Health Directorate.
A mental health nurse accompanied the research team to each data collection site. Students who screened positive for suicidal ideation on the PHQ-9 were referred to this nurse on-site for further assessment and care where necessary.
4.1 Socio-Demographic Characteristics of Participants
Of 217 SHS students, 140 (64.5%) were female. Ages ranged from 15–19 years (M=17.8, SD=0.9), with 134 (61.7%) aged 18 or older. Most students (205, 94.5%) lived with parents or guardians during vacation, and 202 (93.1%) were boarding students. Participants were roughly evenly split across class levels: 66 (30.4%) in SHS 1, 75 (34.6%) in SHS 2, and 76 (35.0%) in SHS 3 (Table 1).
A class-level breakdown (Form/SHS level) is reported in Table 1; a per-school breakdown was not retained in the dataset extract used for this revision, as the three sampled schools were treated as a single combined sampling frame at the point of data extraction.
Table 1
Socio-demographic characteristics of participants (N=217)
| Variable | n | % |
| Sex | ||
| Male | 77 | 35.5 |
| Female | 140 | 64.5 |
| Age group | ||
| <18 years | 83 | 38.3 |
| ≥18 years | 134 | 61.7 |
| Mean age ± SD (range) | 17.8 ± 0.9 (15–19) | |
| Residence during vacation | ||
| Rural | 139 | 64.1 |
| Urban | 78 | 35.9 |
| Lives with parents/guardian during vacation | ||
| Yes | 205 | 94.5 |
| No | 12 | 5.5 |
| Student type | ||
| Boarding | 202 | 93.1 |
| Day | 15 | 6.9 |
| Class | ||
| SHS 1 | 66 | 30.4 |
| SHS 2 | 75 | 34.6 |
| SHS 3 | 76 | 35.0 |
4.2 Prevalence and Severity of Depressive Symptoms
Fifty-six of 217 students (25.8%, 95% CI: 20.4–32.0) met criteria for probable depression (PHQ-9 ≥10). Depression severity was distributed as follows: none/minimal, 27.2%; mild, 47.0%; moderate, 18.9%; moderately severe, 4.2%; severe, 2.8% (mean score 7.28 ± 4.79, range 0–27) (Tables 2–3).
Among individual PHQ-9 items, worry (mean 0.98) and difficulty concentrating (mean 0.88) and feeling restless (mean 0.88) scored highest, while suicidal ideation scored lowest on average (mean 0.57) but this average masks a finding that deserves more direct attention than the manuscript previously gave it: 94 of 217 students (43.3%, 95% CI: 36.9–50.0) reported experiencing suicidal ideation at least occasionally in the past two weeks, including 23 students (10.6%) who reported it frequently or always. Given the ethical implications of this figure, it is addressed directly in Section 3.5 above and should not be read only as a component of the overall PHQ-9 average.
Table 2
Prevalence of mental health issues from items of the PHQ-9 (N=217)
| Item | Not at all | Occasionally | Frequently | Always | Mean | SD |
| Feeling sad or hopeless | 91 (41.9%) | 100 (46.1%) | 14 (6.5%) | 12 (5.5%) | 0.76 | 0.81 |
| Losing interest in enjoyable things | 98 (45.2%) | 77 (35.5%) | 32 (14.8%) | 10 (4.6%) | 0.79 | 0.86 |
| Difficulty sleeping | 100 (46.1%) | 84 (38.7%) | 29 (13.4%) | 4 (1.8%) | 0.71 | 0.77 |
| Tired even after resting | 84 (38.7%) | 90 (41.5%) | 30 (13.8%) | 13 (6.0%) | 0.87 | 0.87 |
| Difficulty concentrating in class | 87 (40.1%) | 81 (37.3%) | 38 (17.5%) | 11 (5.1%) | 0.88 | 0.88 |
| Feeling nervous/anxious | 83 (38.3%) | 96 (44.2%) | 27 (12.4%) | 11 (5.1%) | 0.84 | 0.83 |
| Worrying too much | 71 (32.7%) | 95 (43.8%) | 35 (16.1%) | 16 (7.4%) | 0.98 | 0.89 |
| Feeling restless | 82 (37.8%) | 90 (41.5%) | 33 (15.2%) | 12 (5.5%) | 0.88 | 0.86 |
| Suicidal ideation | 123 (56.7%) | 71 (32.7%) | 17 (7.8%) | 6 (2.8%) | 0.57 | 0.76 |
Table 3
Depression categorisation from PHQ-9 total score (N=217)
| Category (score range) | n | % |
| None/minimal (0–4) | 59 | 27.2 |
| Mild (5–9) | 102 | 47.0 |
| Moderate (10–14) | 41 | 18.9 |
| Moderately severe (15–19) | 9 | 4.2 |
| Severe (20–27) | 6 | 2.8 |
| Mean ± SD (range) | 7.28 ± 4.79 (0–27) |
Figure 1
Prevalence of probable depression among SHS students (25.8%, 95% CI: 20.4–32.0)
4.3 Mental Health Literacy and Help-Seeking Patterns
Most students (184, 84.8%, 95% CI: 79.4–89.0) recognised the term “mental health,” but only 59 (27.2%, 95% CI: 21.7–33.5) could define it accurately. This gap between recognition and understanding matches patterns reported among Bangladeshi university students, where awareness likewise outpaced accurate understanding (Siddique et al., 2022). The most common definition offered “being mentally sick or mad” (48.9%) reflects a framing of mental illness as severe psychiatric disorder rather than a spectrum that includes the mild-to-moderate symptoms most students in this sample actually reported; this conceptual gap is explored further in Section 5.2.
School was the leading source of mental health information (59.9%), ahead of friends/family (9.7%) and media (9.2%); 15.2% had never learned about mental health from any source. Overall knowledge was classified as fair for 146 students (67.3%, 95% CI: 60.8–73.2), good for 34 (15.7%, 95% CI: 11.4–21.1), and poor for 37 (17.1%, 95% CI: 12.6–22.6) though see Section 3.3 regarding the classification criteria, which need to be specified explicitly (Table 4).
Overall knowledge classification was not significantly associated with help-seeking status (χ2=2.23, p=0.327; Table 8), addressing RQ2 directly: students classified as having good, fair, or poor mental health knowledge did not differ significantly in whether they had ever sought help.
Table 4
Knowledge of mental health among SHS students (N=217)
| Variable | n | % |
| Awareness of the term “mental health” | ||
| Yes | 184 | 84.8 |
| No | 33 | 15.2 |
| First source of information | ||
| School | 130 | 59.9 |
| Friends/family | 21 | 9.7 |
| Media | 20 | 9.2 |
| Health workers | 11 | 5.1 |
| Religious institutions | 2 | 0.9 |
| Never learned about mental health | 33 | 15.2 |
| Meaning of “mental health” | ||
| Being mentally sick or mad | 106 | 48.9 |
| How we think, feel, and behave | 59 | 27.2 |
| Being emotionally weak | 23 | 10.6 |
| Do not know | 29 | 13.4 |
| Overall knowledge classification | ||
| Fair | 146 | 67.3 |
| Poor | 37 | 17.1 |
| Good | 34 | 15.7 |
4.4 Barriers to Service Utilisation and Predictors of Non-Help-Seeking
Most students (149, 68.7%, 95% CI: 62.2–74.5) had never sought help for a mental health concern, despite most (137, 63.1%, 95% CI: 56.5–69.3) being aware of at least one place where adolescents could seek help. Among the 149 who had never sought help, the leading reasons were not knowing where to go (57.0%), fear of others’ judgment (24.2%), belief the problem would resolve on its own (18.1%), shame or embarrassment (16.1%), lack of nearby services (20.1%), family disapproval (10.1%), and cost (9.4%).
That “not knowing where to go” outranked stigma-related reasons is worth noting on its own terms: it points to a navigational gap that is, in principle, cheaper to fix than stigma is a distinction developed further in Section 5.2. Family support expectations were relatively high (148 students, 68.2%, expected family support if diagnosed), yet this did not translate into actual help-seeking; that disconnect is addressed in Section 5.2 rather than left as an unresolved tension.
A cross-tabulation of reasons for not seeking help by sex, age group, and class (Table 10) shows broadly similar rank-ordering of barriers across these groups, with “did not know where to go” the leading reason in every subgroup; female students and those aged 18 and older accounted for a larger share of most reasons, consistent with their larger share of the non-help-seeking group overall (Table 8).
Table 5
Barriers in accessing mental health services (N=217)
| Variable | n | % |
| Aware of a place to seek help | ||
| Yes | 137 | 63.1 |
| No | 80 | 36.9 |
| Ever sought help for a mental health concern | ||
| Yes | 68 | 31.3 |
| No | 149 | 68.7 |
| Reasons for not seeking help (of n=149) | ||
| Did not know where to go | 85 | 57.0 |
| Afraid of what others would think | 36 | 24.2 |
| No services nearby | 30 | 20.1 |
| Thought it would go away | 27 | 18.1 |
| Ashamed or embarrassed | 24 | 16.1 |
| Family didn’t support it | 15 | 10.1 |
| Cost too high | 14 | 9.4 |
| Perceived family response if diagnosed | ||
| Would support me | 148 | 68.2 |
| Would be angry/disappointed | 28 | 12.9 |
| Don’t know | 23 | 10.6 |
| Would ignore me | 18 | 8.3 |
4.5 Perceived Role and Acceptability of School-Based Mental Health Support
Guidance/counselling services were reported available by 121 students (55.8%, 95% CI: 49.1–62.2), but only 51 (23.5%, 95% CI: 18.4–29.6) had ever used them a 32-point gap between reported availability and actual use that is larger than the gap for almost any other service in this dataset. Most students (181, 83.4%, 95% CI: 77.9–87.8) agreed schools should play a central role in mental health support, and mental health education was the most requested support type (119 students, 54.8%, 95% CI: 48.2–61.3), ahead of counselling services (39.6%), free screening days (25.3%), peer support groups (22.6%), and professional referral (9.2%) (Table 6).
Table 6
Role of school-based interventions (N=217)
| Variable | n | % |
| Services offered by school | ||
| Guidance/counselling | 121 | 55.8 |
| Mental health education in class | 75 | 34.6 |
| Awareness programs | 45 | 20.7 |
| Peer support/mental health clubs | 25 | 11.5 |
| None of the above | 33 | 15.2 |
| Ever used school mental health support | ||
| Yes | 51 | 23.5 |
| No | 166 | 76.5 |
| Comfortable talking to a teacher/counsellor | ||
| Yes | 128 | 59.0 |
| No | 58 | 26.7 |
| Maybe | 31 | 14.3 |
| Preferred school support type | ||
| Mental health education | 119 | 54.8 |
| Counselling services | 86 | 39.6 |
| Free screening days | 55 | 25.3 |
| Peer support groups | 49 | 22.6 |
| Referral to professionals | 20 | 9.2 |
| Schools should play a key role | ||
| Yes | 181 | 83.4 |
| No | 16 | 7.4 |
| Not sure | 20 | 9.2 |
4.6 Bivariate Analysis of Socio-Demographic Factors and Key Outcomes
Table 7 presents bivariate relationships between socio-demographic characteristics and three outcomes: mean PHQ-9 score, probable depression status, and help-seeking behaviour, using independent-samples t-tests (continuous) and Pearson chi-square tests (categorical), at p<0.05.
Sex was the only demographic variable significantly associated with more than one outcome. Female students recorded a higher mean PHQ-9 score than males (7.80 vs 6.30, t=2.276, p=0.024) and were significantly less likely to have ever sought help (25.0% had sought help vs 42.9% of males, χ²=7.362, p=0.007) despite reporting probable depression at a numerically, though not statistically significantly, higher rate (29.3% vs 19.5%, χ²=2.494, p=0.114). This combination a real difference in reported symptom burden alongside a significant difference in help-seeking, without the depression-status gap itself reaching significance is discussed as a pattern worth attention in its own right in Section 5.1, rather than as a contradiction to resolve away.
Age group was significantly associated with mental health knowledge (χ²=12.027, p=0.002), with students aged 18+ more often classified as having good overall knowledge, but was not significantly associated with PHQ-9 score, depression status, or help-seeking. Residence type and student type (boarding/day) showed no statistically significant association with any of the three primary outcomes, though the small day-student subgroup (n=15) limits what can be concluded from that comparison specifically.
A logistic regression and knowledge-classification row for help-seeking status are now reported separately in Table 8, alongside the completed unadjusted logistic regression in Table 9, rather than as an additional row within Table 7.
Table 7
Bivariate Analysis of Socio-Demographic Factors and Key Outcomes (N=217)
| Variable | PHQ-9 Mean (SD) | t | p | Probable Depression n(%) | χ² | p | Never Sought Help n(%) | χ² | p |
| Female (n=140) | 7.80 (4.90) | 2.276 | 0.024* | 41 (29.3%) | 2.494 | 0.114 | 105 (75.0%) | 7.362 | 0.007* |
| Male (n=77) | 6.30 (4.50) | 15 (19.5%) | 44 (57.1%) | ||||||
| ≥18 years (n=134) | 7.50 (4.80) | 0.895 | 0.372 | 37 (27.6%) | 0.596 | 0.440 | 88 (65.7%) | 1.458 | 0.227 |
| <18 years (n=83) | 6.90 (4.80) | 19 (22.9%) | 61 (73.5%) | ||||||
| Rural (n=139) | 7.60 (4.90) | 1.351 | 0.178 | 39 (28.1%) | 1.023 | 0.312 | 99 (71.2%) | 1.177 | 0.278 |
| Urban (n=78) | 6.70 (4.60) | 17 (21.8%) | 50 (64.1%) | ||||||
| Boarding (n=202) | 7.30 (4.80) | 0.382 | 0.703 | 52 (25.7%) | 0.006 | 0.940 | 138 (68.3%) | 0.163 | 0.686 |
| Day (n=15) | 6.80 (4.90) | 4 (26.7%) | 11 (73.3%) |
Note: Independent samples t-test for PHQ-9 mean score; Pearson chi-square (χ²) for categorical comparisons. *p<0.05. Age group was significantly associated with knowledge classification (χ²=12.027, p=0.002), reported in text above rather than in this table.
An unadjusted binary logistic regression was run to identify predictors of non-help-seeking, and help-seeking status was additionally cross-tabulated against knowledge classification and other socio-demographic variables (Table 8). Type of residence during vacation was the only significant predictor: students who spent vacation in an urban setting had significantly higher odds of never having sought help than rural students (OR=2.08, 95% CI: 1.10–3.94, p=0.025; Table 9). Knowledge classification was not significantly associated with help-seeking status (χ2=2.23, p=0.327), directly answering RQ2. Reasons for not seeking help were further examined by sex, age group, and class (Table 10); “did not know where to go” was the leading reason across every subgroup, and female students and those aged 18 or older accounted for a majority share of most reasons, mirroring their larger share of the overall non-help-seeking group.
Table 8
Association Between Help-Seeking Status and Socio-Demographic/Knowledge Factors (N=217)
| Variable | Ever sought help Yes n(%) | Ever sought help No n(%) | χ² | p-value |
| Total (N=217) | 68 (31.3%) | 149 (68.7%) | ||
| Sex | ||||
| Male | 22 (32.4) | 55 (36.9) | 0.42 | 0.515 |
| Female | 46 (67.6) | 94 (63.1) | ||
| Age group | ||||
| <18 years | 23 (33.8) | 60 (40.3) | 0.82 | 0.365 |
| ≥18 years | 45 (66.2) | 89 (59.7) | ||
| Type of residence during vacation | ||||
| Rural | 51 (75.0) | 88 (59.1) | 5.15 | 0.023* |
| Urban | 17 (25.0) | 61 (40.9) | ||
| Living with parents/guardians during vacation | ||||
| Yes | 65 (95.6) | 140 (94.0) | 0.757† | |
| No | 3 (4.4) | 9 (6.0) | ||
| Type of student | ||||
| Boarding | 65 (95.6) | 137 (91.9) | 0.400† | |
| Day | 3 (4.4) | 12 (8.1) | ||
| Class | ||||
| SHS 1 | 22 (32.4) | 44 (29.5) | 0.26 | 0.876 |
| SHS 2 | 22 (32.4) | 53 (35.6) | ||
| SHS 3 | 24 (35.3) | 52 (34.9) | ||
| Knowledge on mental health | ||||
| Poor | 13 (19.1) | 24 (16.1) | 2.23 | 0.327 |
| Fair | 48 (70.6) | 98 (65.8) | ||
| Good | 7 (10.3) | 27 (18.1) | ||
| Depression status | ||||
| No depression | 45 (66.2) | 116 (77.9) | 3.32 | 0.068 |
| Probable depression | 23 (33.8) | 33 (22.2) |
Table 9
Unadjusted Logistic Regression for Factors Associated with Non-Help-Seeking
| Variable | Unadjusted OR (95% CI) | p-value |
| Type of residence during vacation | ||
| Rural | Ref | |
| Urban | 2.08 (1.10–3.94) | 0.025* |
Table 10
Reasons for Not Seeking Help by Sex, Age Group, and Class
| Reason for not seeking help | Female n(%) | Male n(%) | <18y n(%) | ≥18y n(%) | SHS1 n(%) | SHS2 n(%) | SHS3 n(%) |
| Did not know where to go | 56 (65.9) | 29 (34.1) | 33 (38.8) | 52 (61.2) | 28 (32.9) | 24 (28.2) | 33 (38.8) |
| Afraid of what others would think | 26 (72.2) | 10 (27.8) | 13 (36.1) | 23 (63.9) | 9 (25.0) | 14 (38.9) | 13 (36.1) |
| No mental health services nearby | 24 (80.0) | 6 (20.0) | 9 (30.0) | 21 (70.0) | 8 (26.7) | 11 (36.7) | 11 (36.7) |
| Cost of care too high | 13 (92.9) | 1 (7.1) | 8 (57.1) | 6 (42.9) | 7 (50.0) | 4 (28.6) | 3 (21.4) |
| Family didn’t support it | 11 (73.3) | 4 (26.7) | 4 (26.7) | 11 (73.3) | 6 (40.0) | 3 (20.0) | 6 (40.0) |
| Thought it would go away | 16 (59.3) | 11 (40.7) | 13 (48.1) | 14 (51.9) | 9 (33.3) | 10 (37.0) | 8 (29.6) |
| Ashamed or embarrassed | 20 (83.3) | 4 (16.7) | 8 (33.3) | 16 (66.7) | 5 (20.8) | 13 (54.2) | 6 (25.0) |
5. Discussion
5.1 Comparison with Past Studies in Ghana and Similar LMIC Contexts
At 25.8%, probable depression prevalence in this sample sits close to global estimates Paiva et al. (2025) reported roughly 25% among university students worldwide, and Cervantes-Cardona et al. (2022) found 25.2% during the COVID-19 period in Mexico but well below the 41.4% Nakie et al. (2022) reported in Ethiopia using DASS-21. Given that the two studies use different instruments and cut-offs, this gap is more plausibly a measurement artefact than a true difference in underlying burden and should not be read as evidence that Jaman North students are less affected than Ethiopian students. What can be compared more directly is item pattern: worry and difficulty concentrating were the most endorsed PHQ-9 items here, consistent with academic-stress-driven symptom profiles reported across other SSA adolescent samples.
5.2 Interpretation of Key Findings: Prevalence, Literacy Gaps, and Access Barriers
The gap between recognising the term “mental health” (84.8%) and defining it correctly (27.2%) is not simply a literacy shortfall it is informative about what students think the term refers to. Nearly half (48.9%) equated it with “being mentally sick or mad,” which frames mental illness as a severe, visibly disordered state rather than something that includes the mild-to-moderate depressive symptoms 47% of this sample reported. If students hold this framing, it plausibly explains why so few connect their own everyday symptoms poor concentration, low energy, worry to “mental health” as a category worth acting on. Siddique et al. (2022) found a similar recognition-without-understanding pattern among Bangladeshi university students, suggesting this is not unique to Jaman North, but the specific content of the misunderstanding here equating mental health with insanity is a Ghana- and West-Africa-specific framing tied to how mental illness is culturally categorised, distinct from the generic “low literacy” explanation.
The dominance of “not knowing where to go” (57.0%) over stigma-related reasons (24.2%) as a barrier to help-seeking is the finding this revision treats as most actionable. Navigational barriers are, in principle, addressable through information provision service directories, orientation sessions, signage at a fraction of the cost and time required to shift stigma, which typically needs sustained, multi-year destigmatisation work. This does not mean stigma is unimportant here: nearly a quarter of non-help-seekers cited it, and 68.2% of students who did expect family support nonetheless mostly had not sought help, suggesting expected support does not, by itself, overcome uncertainty about where to go. The two barriers likely compound rather than operate independently, but the practical implication is that a low-cost navigational intervention could plausibly move the largest single barrier without waiting for the slower work of destigmatisation to bear fruit.
5.3 Practical Implications for Policy, School Health Programs, and Community Engagement
Three actions follow directly from these findings, specifically to what Jaman North’s schools and district health directorate could plausibly resource:
First, PHQ-9-based screening could be added to existing annual school health checks, which already occur in most SHS institutions in the district; this would not require new infrastructure, only an additional instrument and a referral protocol for students who screen positive the same protocol gap flagged in Section 3.5 for this study’s own data collection.
Second, given that mental health education was the most-requested support type (54.8%) and that the term/definition gap identified above is specific and addressable, curriculum content should go beyond naming “mental health” as a topic and explicitly teach: an accurate working definition, recognition of common conditions, and directly targeting the largest barrier identified here where in the district a student can actually go for help. Ma, Anderson and Burn (2022) found this kind of literacy-focused programming has moderate evidence of effectiveness, which is a realistic expectation to set rather than an assumption of large effects.
Third, the 32-point gap between reported counselling availability (55.8%) and actual use (23.5%) suggests the existing counselling infrastructure is underused rather than absent. Given Addy et al.’s (2021) finding that Ghanaian school guidance units are often distrusted over confidentiality and staffed without counselling training, the underuse documented here plausibly reflects the same structural weakness rather than students simply not needing the service. Formalising a referral link between school counsellors and the District Health Directorate, alongside basic confidentiality-protecting triage training for counsellors, is a lower-cost intervention than building new services from scratch.
Figure 2
A Stepwise Logic Model for Overcoming Barriers to Adolescent Mental Health Care in Rural Ghana
5.4 Theoretical Contributions to Adolescent Mental Health Frameworks in Rural Africa
These findings support extending existing LMIC help-seeking models with a distinct “service navigation literacy” component, separate from general mental health literacy: knowing that a problem exists and warrants help is not the same as knowing which door to walk through, and this study finds the second gap larger than the first among Jaman North students specifically (Mullen, Levitt and Markoulakis, 2022, describe a similar navigation-specific barrier in patient navigation literature more broadly).
The gap between attitude and use is also notable on its own terms: 83.4% of students think schools should play a central mental health role, yet only 23.5% have used existing school services. This aspiration-utilisation gap is not fully explained by attitudinal resistance, since the attitude is clearly favourable; awareness of what is actually offered, confidence in confidentiality, and perceived ease of access are more likely explanations, and distinguishing between them is a task for future qualitative work rather than something this cross-sectional dataset can resolve on its own.
This study has several limitations. First, the cross-sectional design precludes causal inference associations between, for example, knowledge and help-seeking history cannot be read as directional. Second, self-report on sensitive topics such as suicidal ideation is subject to social desirability bias in both directions (under- and over-reporting), which should temper how precisely the 43.3% ideation figure is interpreted. Third, the PHQ-9 is a screening tool, not a diagnostic one; the 25.8% prevalence figure reflects probable, not confirmed, depression. Fourth, findings are specific to Jaman North District and should not be generalised to other rural Ghanaian districts or to urban SHS populations without further study. Fifth, the mental health literacy and barrier items used here are study-specific rather than adapted from a validated Ghanaian adolescent MHL scale, and as noted in Section 3.3 reliability statistics (Cronbach’s alpha) for these items were not computed for this sample; this should be reported once the original analysis output is retrieved. The PHQ-9 itself, by contrast, has separate Ghana-specific validation evidence among SHS students (Anum, Adjorlolo and Kugbey, 2019), cited in Section 3.3. Sixth, the logistic regression reported in Section 4.6 is unadjusted (a single-predictor model) rather than a multivariable model controlling for all socio-demographic variables simultaneously; a fully adjusted model would be a natural extension in future work.
5.6 Directions for Future Research
Longitudinal cohort work would clarify whether the associations identified here are directional particularly whether low literacy precedes or follows non-help-seeking. Mixed methods work, especially in-depth interviews with students, teachers, and counsellors, could unpack why the navigational barrier is so dominant in this specific district. Randomised trials of school-based mental health education, powered to detect changes in service-navigation knowledge specifically (not just general literacy), would test whether the intervention proposed in Section 5.3 actually closes the gap identified here. Costing studies would help the District Health Directorate assess what a district-wide screening and referral programme would require in practice.
This study provides the first district-level assessment of adolescent mental health care gaps among SHS students in Jaman North, rural Ghana. A quarter of students met criteria for probable depression, and 43.3% reported at least occasional suicidal ideation figures that argue for treating this as a public health priority rather than a peripheral concern. The dominant obstacle to care is not primarily attitudinal: 83.4% of students want schools to play a central mental health role, and 68.2% expect family support if diagnosed. The obstacle is navigational most students who have never sought help simply do not know where to go which is a more tractable problem than entrenched stigma, and one that low-cost information and referral interventions could plausibly address without waiting for slower cultural change.
Three concrete steps follow: integrate PHQ-9 screening into existing school health checks with a defined referral pathway; make mental health education, specifically including service-navigation information, part of the standard curriculum; and formalise a referral link between school counsellors and the District Health Directorate. None of these requires large new infrastructure, which matters given the resource constraints documented throughout this manuscript.
This study also demonstrates that a focused, school-based mental health assessment is feasible to conduct at the district level in a rural LMIC setting, using standardised screening alongside locally developed literacy and barrier instruments a template other similarly under-resourced districts could adapt, pending the additional psychometric and analytic work flagged throughout Sections 3–5 of this revision.
Ethical Approval Statement
This study was conducted in accordance with the Declaration of Helsinki. Ethical approval for the study titled Assessing Gaps in Adolescent Mental Health Care in Rural Ghana: A Quantitative Study Among Senior High School Students in Jaman North District was obtained from the Committee on Human Research, Publications, and Ethics (CHRPE), Ghana (Approval Ref: CHRPE/AP/238/25). The approval was granted on 2nd April 2025 and was valid until 1st April 2026. Permission was also obtained from the District Health Directorate, Sampa (study site), via a notification letter dated 22nd January 2025.
Informed Consent Statement
Written informed consent was obtained from all participants aged 18 years and above. For participants under 18 years, parental or guardian consent was obtained, along with the participant’s assent. All participants were informed of their right to withdraw from the study at any time without consequence. Data was used solely for the approved purposes as outlined in the approved protocol.
Conflicts of Interest
The authors declare no conflicts of interest.
Funding Statement
This research received no external funding.
Author Contributions
Author 1 conceptualized the study, developed the methodology, performed formal analysis, conducted the investigation, and drafted the original manuscript, as well as reviewed and edited subsequent versions. Authors 2 and 3 contributed to data collection, investigation, and manuscript review and editing. Author 4 provided supervision, methodological guidance, validation of findings, and manuscript review and editing. Author 5 performed data curation, conducted the literature review, and contributed to manuscript review and editing. Author 6 assisted with data entry, literature review, and manuscript review and editing. All authors read and approved the final manuscript.
Data Availability Statement
The datasets generated and analyzed during this study are available from the corresponding author upon reasonable request, subject to institutional data protection policies and ethical restrictions.
References
Abesinghe, A.M.I.D., Katuwawela, K.P.D.K.I., Lakmali, K.P.W., Jayanetti, N.L., Munidasa, K., Silva, B. and Faiz (2023). Mental health literacy: A Survey of the Public’s Ability to Recognize Mental Disorders and Their Knowledge about the Effectiveness of Helpful Interventions to Help the Victims. Journal of Evidence-Based Psychotherapies, 23(2), pp.173–202. doi: https://doi.org/10.24193/jebp.2023.2.16.
Addy, N.D., Agbozo, F., Runge-Ranzinger, S. and Grys, P. (2021). Mental health difficulties, coping mechanisms and support systems among school-going adolescents in Ghana: A mixed-methods study. PLOS One, 16(4), p.e0250424. doi: https://doi.org/10.1371/journal.pone.0250424.
Agblevor, E.A., Darko, N.A., Acquah, P.A., Addom, S., Mirzoev, T. and Agyepong, I.A. (2023). “We have nice policies but…”: implementation gaps in the Ghana adolescent health service policy and strategy (2016–2020). Frontiers in Public Health, 11, p.1198150. doi: https://doi.org/10.3389/fpubh.2023.1198150.
Ahorsu, D.K., Sánchez Vidaña, D.I., Lipardo, D., Shah, P.B., Cruz González, P., Shende, S., Gurung, S., Venkatesan, H., Duongthipthewa, A., Ansari, T.Q. and Schoeb, V. (2021). Effect of a peer‐led intervention combining mental health promotion with coping‐strategy‐based workshops on mental health awareness, help‐seeking behavior, and wellbeing among university students in Hong Kong. International Journal of Mental Health Systems, 15(1). doi: https://doi.org/10.1186/s13033-020-00432-0.
Anum, A., Adjorlolo, S. and Kugbey, N. (2019). Depressive symptomatology in adolescents in Ghana: Examination of psychometric properties of the Patient Health Questionnaire-9. Journal of Affective Disorders, 256, pp.213–218. doi: https://doi.org/10.1016/j.jad.2019.06.007.
Allie, S.-L.N., Bantjes, J. and Andriessen, K. (2024). Best-practice recommendations for campus-based suicide postvention intervention at a South African university in the Western Cape: An expert consensus study. Death Studies, pp.1–9. doi: https://doi.org/10.1080/07481187.2024.2437475.
Baklola, M., Terra, M., Taha, A., Elnemr, M., Yaseen, M., Maher, A., Ali Hussain Buzaid, Rahaf Alenazi, Mohamed, Abdelhady, D. and Abdel-Hady El-Gilany (2024). Mental health literacy and help-seeking behaviour among Egyptian undergraduates: a cross-sectional national study. BMC Psychiatry, 24(1). doi: https://doi.org/10.1186/s12888-024-05620-7.
Baloji, D., Ntambwe, G., Ntambua, A., Kidinda, W., Kazadi, M.B., Mpanya, A., Mukuna, B., Ngongo, L., Mjumbe, C., Mutombo K, A. and Lutumba, P. (2025). Perceptions, Challenges and Barriers to HIV Care in Mbujimayi in the East Kasai Province, DR Congo: A Qualitative Study. HIV/AIDS – Research and Palliative Care, 17, pp.297–311. doi: https://doi.org/10.2147/hiv.s541334.
Bantjes, J., Kessler, M.J., Hunt, X., Stein, D.J. and Kessler, R.C. (2023). Treatment rates and barriers to mental health service utilisation among university students in South Africa. International Journal of Mental Health Systems, 17(1). doi: https://doi.org/10.1186/s13033-023-00605-7.
Bu, D., Zhang, C.-Q., Liang, W., Han, Z., Yi, N., Su, N. and Huang, Z. (2024). Mental health literacy and help-seeking intention among Chinese elite athletes: the mediating roles of stigma and social support. Frontiers in Psychology, 15. doi: https://doi.org/10.3389/fpsyg.2024.1332343.
Cervantes-Cardona, G.A., Cervantes-Guevara, G., Cervantes-Pérez, E., Fuentes-Orozco, C., Barbosa-Camacho, F.J., Chejfec-Ciociano, J.M., Brancaccio-Pérez, I.V., Zarate-Casas, M.F., González-Ponce, F.Y., Ascencio-Díaz, K.V., Guzmán-Ruvalcaba, M.J., Cueto-Valadez, T.A., Cueto-Valadez, A.E. and González-Ojeda, A. (2022). Prevalence of Depression, Anxiety, and Stress among High School Students during the COVID-19 Pandemic: A Survey Study in Western Mexico. International Journal of Environmental Research and Public Health, 19(23), p.16154. doi: https://doi.org/10.3390/ijerph192316154.
Chikumbu, E.F., Bunn, C., Kasenda, S., Dube, A., Phiri-Makwakwa, E., Jani, B.D., Jobe, M., Wyke, S., Seeley, J., Crampin, A.C. and Mair, F.S. (2022). Experiences of multimorbidity in urban and rural Malawi: An interview study of burdens of treatment and lack of treatment. PLOS Global Public Health, 2(3), p.e0000139. doi: https://doi.org/10.1371/journal.pgph.0000139.
Fernandes, M. da S.V., Mendonça, C.R., da Silva, T.M.V., Noll, P.R. e S., de Abreu, L.C. and Noll, M. (2023). Relationship between depression and quality of life among students: a systematic review and meta-analysis. Scientific Reports, 13(1), p.6715. doi: https://doi.org/10.1038/s41598-023-33584-3.
Goodfellow, C., Macintyre, A., Knifton, L. and Sosu, E. (2022). Associations between dimensions of mental health literacy and adolescent help‐seeking intentions. Child and Adolescent Mental Health, 28(3). doi: https://doi.org/10.1111/camh.12608.
Goodfellow, C., Willis, M., Inchley, J., Kharicha, K., Leyland, A.H., Qualter, P., Simpson, S. and Long, E. (2023). Mental health and loneliness in Scottish schools: A multilevel analysis of data from the health behaviour in school‐aged children study. British Journal of Educational Psychology. doi: https://doi.org/10.1111/bjep.12581.
Graves, J.M., Abshire, D.A., Koontz, E. and Mackelprang, J.L. (2024). Identifying Challenges and Solutions for Improving Access to Mental Health Services for Rural Youth: Insights from Adult Community Members. International Journal of Environmental Research and Public Health, 21(6), p.725. doi: https://doi.org/10.3390/ijerph21060725.
Karki, A., Thapa, B., Pradhan, P.M.S. and Basel, P. (2022). Depression, anxiety and stress among high school students: A cross-sectional study in an urban municipality of Kathmandu, Nepal. PLOS Global Public Health, 2(5), p.e0000516. doi: https://doi.org/10.1371/journal.pgph.0000516.
Kim, S., Hwang, J., Lee, J.H., Park, J., Kim, H.J., Son, Y., Oh, H., Smith, L., Kang, J., Fond, G., Boyer, L., Rahmati, M., Tully, M.A., Damiano Pizzol, Udeh, R., Lee, J., Lee, H., Lee, S. and Yon, D.K. (2024). Psychosocial alterations during the COVID-19 pandemic and the global burden of anxiety and major depressive disorders in adolescents, 1990–2021: challenges in mental health amid socioeconomic disparities. World Journal of Pediatrics, 20. doi: https://doi.org/10.1007/s12519-024-00837-8.
Lai, K.Y.C., Hung, S.-F., Lee, H.W.S. and Leung, P.W.L. (2022). School-Based Mental Health Initiative: Potentials and Challenges for Child and Adolescent Mental Health. Frontiers in Psychiatry, 13. doi: https://doi.org/10.3389/fpsyt.2022.866323.
Le, P.D., Eschliman, E.L., Grivel, M.M., Tang, J., Cho, Y.G., Yang, X., Tay, C., Li, T., Bass, J. and Yang, L.H. (2022). Barriers and facilitators to implementation of evidence-based task-sharing mental health interventions in low- and middle-income countries: a systematic review using implementation science frameworks. Implementation Science, 17(1). doi: https://doi.org/10.1186/s13012-021-01179-z.
Ma, K.K.Y., Anderson, J.K. and Burn, A. (2022). Review: School‐based interventions to improve mental health literacy and reduce mental health stigma – a systematic review. Child and Adolescent Mental Health, 28(2), pp.230–240. doi: https://doi.org/10.1111/camh.12543.
Metzger, I.W., Turner, E.A., Jernigan-Noesi, M.M., Fisher, S., Nguyen, J.K., Shodiya-Zeumault, S. and Griffith, B. (2023). Conceptualizing Community Mental Health Service Utilization for BIPOC Youth. Journal of Clinical Child & Adolescent Psychology, 52(3), pp.1–15. doi: https://doi.org/10.1080/15374416.2023.2202236.
Mullen, J.N., Levitt, A. and Markoulakis, R. (2022). Supporting Individuals with Mental Health and/or Addictions Issues Through Patient Navigation: A Scoping Review. Community Mental Health Journal. doi: https://doi.org/10.1007/s10597-022-00982-2.
Nakie, G., Segon, T., Melkam, M., Desalegn, G.T. and Zeleke, T.A. (2022). Prevalence and associated factors of depression, anxiety, and stress among high school students in, Northwest Ethiopia, 2021. BMC Psychiatry, 22(1). doi: https://doi.org/10.1186/s12888-022-04393-1.
Nemiro, A., Hijazi, Z., O’Connell, R., Coetzee, A. and Snider, L. (2022). Mental health and psychosocial wellbeing in education: The case to integrate core actions and interventions into learning environments. Intervention, 20(1), p.36. doi: https://doi.org/10.4103/intv.intv_20_21.
Paiva, U., Cortese, S., Flor, M., Moncada-Parra, A., Lecumberri, A., Eudave, L., Magallón, S., García-González, S., Sobrino-Morras, Á., Piqué, I., Mestre-Bach, G., Solmi, M. and Arrondo, G. (2025). Prevalence of mental disorder symptoms among university students: An umbrella review. Neuroscience & Biobehavioral Reviews, 175, p.106244. doi: https://doi.org/10.1016/j.neubiorev.2025.106244.
Poku, O. (2021). Intersecting Vulnerabilities: The Implications of Disclosure, Stigma, and Mental Health for Individuals Living with HIV in Sub-Saharan Africa. Available at: https://jscholarship.library.jhu.edu/items/c5d3f456-8858-478a-ad5e-1c3ddddc6a98.
Razek, A. and Nasser A H, A. (2025). An Exploration of the Case of Saudi Students’ Engagement, Success and Self-Efficacy at a Mid-Western American University. Available at: https://rave.ohiolink.edu/etdc/view?acc_num=akron1337282450 [Accessed 13 May 2026].
Renwick, L., Pedley, R., Johnson, I., Bell, V., Lovell, K., Bee, P. and Brooks, H. (2022). Mental health literacy in children and adolescents in low- and middle-income countries: a mixed studies systematic review and narrative synthesis. European Child & Adolescent Psychiatry, 33. doi: https://doi.org/10.1007/s00787-022-01997-6.
Siddique, Md.A.B., Ovi, M.R., Ahammed, T., Chowdhury, M.A.B. and Uddin, M.J. (2022). Mental health knowledge and awareness among university students in Bangladesh. Heliyon, 8(10), p.e11084. doi: https://doi.org/10.1016/j.heliyon.2022.e11084.
Williams, S.A., Baldeh, M., Bah, A.J., Dennis, F., Robinson, D.R. and Adeniyi, Y.C. (2025). Pathways to mental health services across local health systems in sub-Saharan Africa: Findings from a systematic review. PLOS One, 20(6), p.e0324064. doi: https://doi.org/10.1371/journal.pone.0324064.
World Health Organization (2025). Mental health of adolescents. Available at: https://www.who.int/news-room/fact-sheets/detail/adolescent-mental-health.
Zhao, Y., Li, Y. and Zhao, J. (2023). A qualitative study of the reasons for delayed medical treatment in adolescents with depression based on the health ecology model. Frontiers in Public Health, 11. doi: https://doi.org/10.3389/fpubh.2023.1124397.
Zhang, Z., Li, L., Wang, H., Dong, K. and Li, D. (2025). Comparative effects of various exercise interventions on anxiety and depression symptoms in children and adolescents: a network meta-analysis of randomized controlled trials. European Child & Adolescent Psychiatry. doi: https://doi.org/10.1007/s00787-025-02893-5.